
 Mongabay, a leading resource for news and perspectives on environmental and conservation issues related to the tropics, has launched Tropical Conservation Science - a new, open access academic e-journal. It will cover a wide variety of scientific and social studies on tropical ecosystems, their biodiversity and the threats posed to them.


Global Carbon Budget: atmospheric CO2 level increasing more rapidly than anticipated
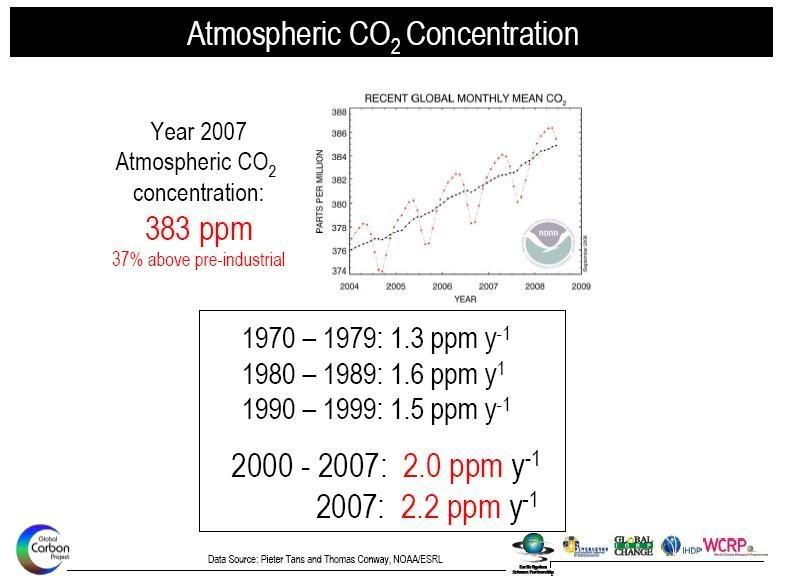
The Global Carbon Project (GCP) has released the Global Carbon Budget for the year 2007. These most recent figures are a key to understanding the balance of carbon added to the atmosphere, the underpinning of human induced climate change. Despite the increasing international sense of urgency, the growth rate of emissions continued to speed up, bringing the atmospheric CO2 concentration to 383 parts per million (ppm) in 2007.
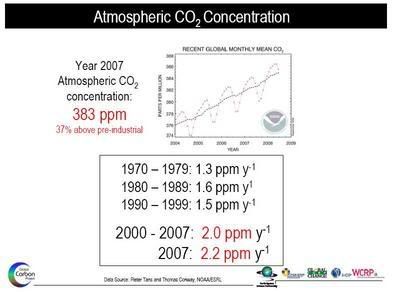
Annual mean growth rate of atmospheric CO2 was 2.2 ppm per year in 2007 (up from 1.8 ppm in 2006), and above the 2.0 ppm average for the period 2000-2007 (figure 1, click to enlarge). The average annual mean growth rate for the previous 20 years was about 1.5 ppm per year. This increase brought the atmospheric CO2 concentration to 383 ppm in 2007, 37% above the concentration at the start of the industrial revolution (about 280 ppm in 1750). The present concentration is the highest during the last 650,000 years and probably during the last 20 million years. [ppm = parts per million]. Anthropogenic CO2 emissions have thus been growing about four times faster since 2000 than during the previous decade, despite efforts to curb emissions in a number of Kyoto Protocol signatory countries.

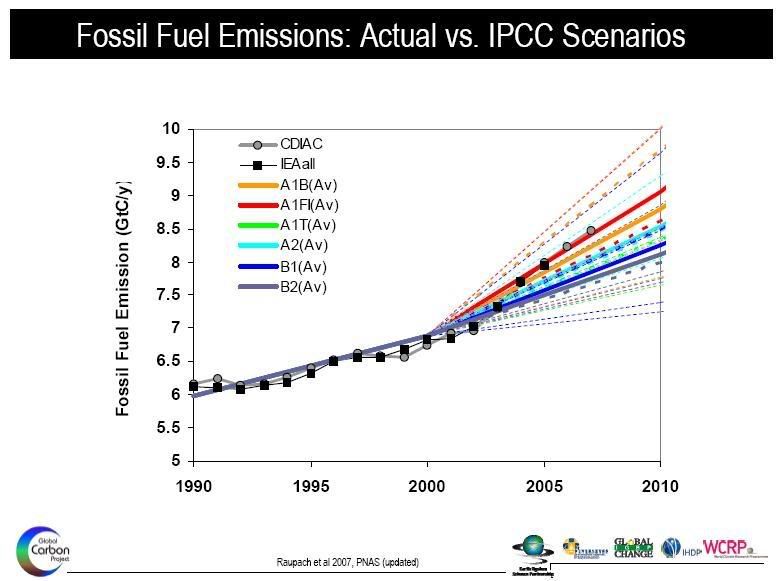
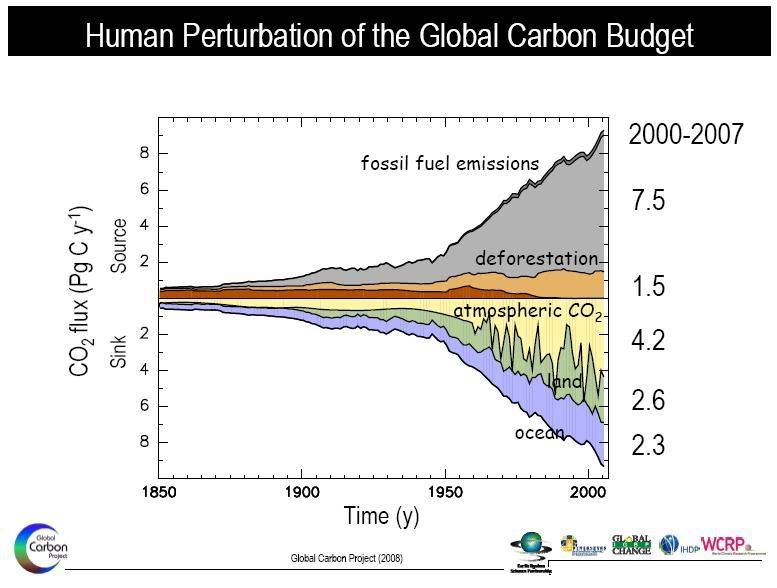
Emissions from fossil fuels and cement increased from 6.2 PgC per year in 1990 to 8.5 PgC in 2007, a 38% increase from the Kyoto reference year 1990. The growth rate of emissions was 3.5% per year for the period of 2000-2007, an almost four fold increase from 0.9% per year in 1990-1999. The actual emissions growth rate for 2000-2007 exceeded the highest forecast growth rates for the decade 2000-2010 in the emissions scenarios of the Intergovermental Panel on Climate Change, Special Report on Emissions Scenarios (IPCC-SRES - figure 2, click to enlarge). This makes current trends in emissions higher than the worst case IPCC-SRES scenario. Fossil fuel and cement emissions released approximately 348 PgC to the atmosphere from 1850 to 2007.
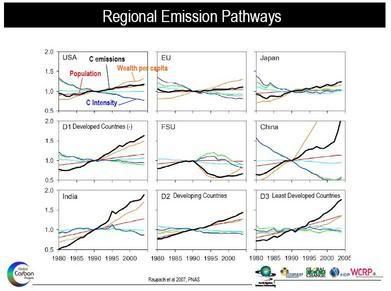
The biggest increase in emissions has taken place in developing countries, largely in China and India, while developed countries have been growing slowly (figure 3, click to enlarge). The largest regional shift was that China passed the U.S. in 2006 to become the largest CO2 emitter, and India will soon overtake Russia to become the third largest emitter. Currently, more than half of the global emissions come from less developed countries. From a historical perspective, developing countries with 80% of the world’s population still account for only 20% of the cumulative emissions since 1751; the poorest countries in the world, with 800 million people, have contributed less than 1% of these cumulative emissions:
 energy :: sustainability :: fossil fuels :: cement :: land-use :: deforestation :: carbon sink :: carbon flux :: carbon budget :: emissions :: climate change ::
After decades of improvements, the carbon intensity of the global economy, the carbon emitted per unit of Gross Domestic Product (GDP), was stalled during the period 2003-2005. This change was largely caused by China’s rapidly growing share in economic output and carbon emissions. Since 2005 China’s energy intensity (which underpins carbon intensity) has decreased (improved) by 1.2% in 2006 and 3.7% in 2007 compared to 2005 levels (according to the National Energy Administration in China).
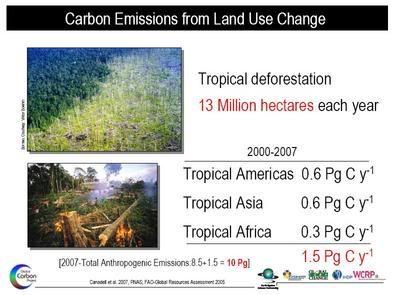
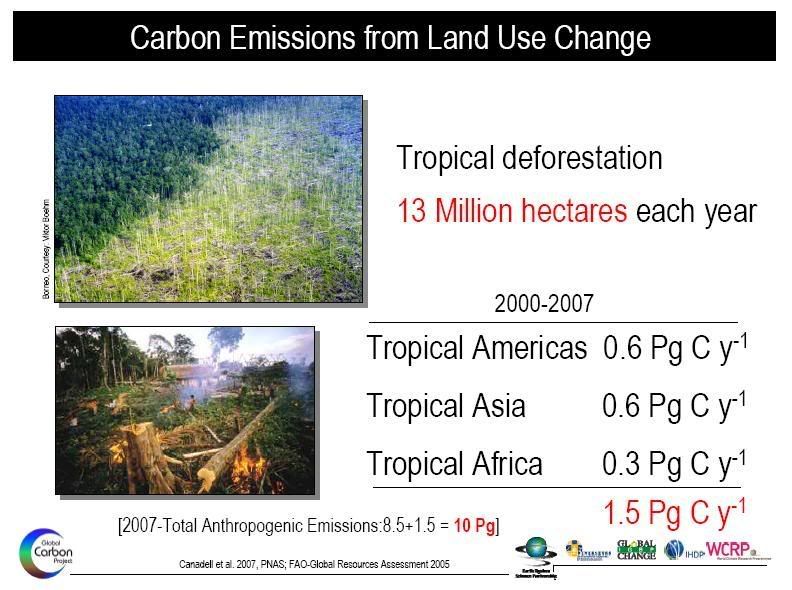
Land use change was responsible for estimated net emissions of 1.5 PgC per year to the atmosphere. This is largely the difference between CO2 emissions from deforestation and CO2 uptake by reforestation. Emissions for 2006 and 2007 were extrapolated from the previous 25-year trend of 1.5 PgC per year. Land use change emissions come almost exclusively from deforestation in tropical countries with an estimated 41% from South and Central America, 43% from South and Southeast Asia, and 17% from Africa (figure 4, click to enlarge). An estimated 160 PgC were emitted to the atmosphere from land use change during the period 1850-2007 [1 Pg = 1 billion tons or 1000 x million tons].
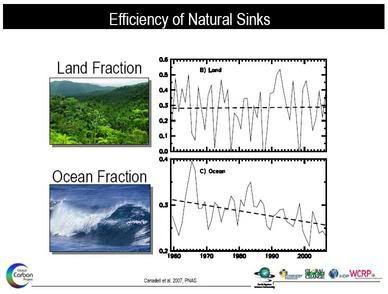
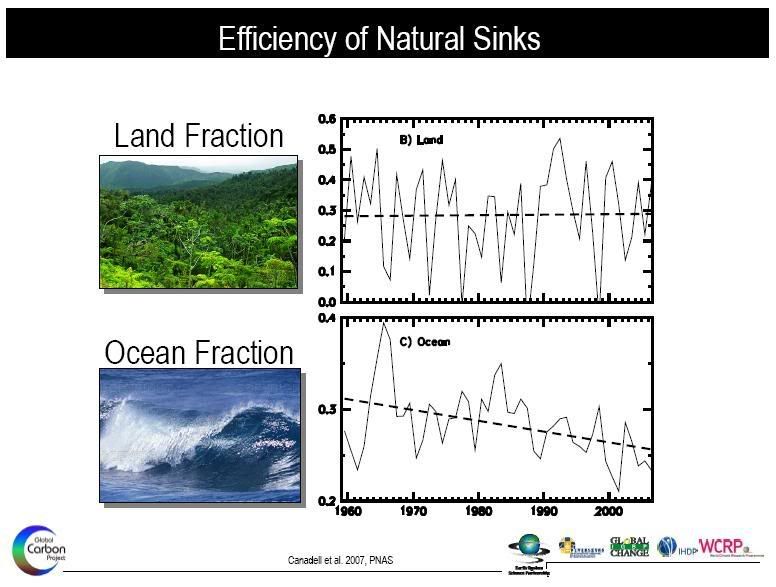
Natural land and ocean CO2 sinks have removed 54% (or 4.8 PgC per year) of all CO2 emitted from human activities during the period 2000-2007. The size of the natural sinks has grown in proportion to increasing atmospheric CO2. However, the efficiency of these sinks in removing CO2 has decreased by 5% over the last 50 years, and will continue to do so in the future (figure 5, click to enlarge). That is, 50 years ago, for every ton of CO2 emitted to the atmosphere, natural sinks removed 600 kg. Currently, the sinks are removing only 550 kg for every ton of CO2 emitted, and this amount is falling.
The global oceanic CO2 sink removed 25% of all CO2 emissions for the period 2000-2007, equivalent to an average of 2.3 PgC per year. The size of the CO2 sink in 2007 was similar to that in the previous year but lower by 0.1 PgC compared to its expected increase from atmospheric CO2 growth. This was due to the presence of a La Nina event in the equatorial Pacific. The Southern Ocean CO2 sink was higher in 2007 compared to 2006, consistent with the relatively weak winds and the low Southern Annular Mode (a circumpolar pressure oscillation between Antarctica and southern mid-latitudes). An analysis of the long term trend of the ocean sink shows a slower growth than expected of the CO2 sink over the last 20 years.
Natural Forest Sink
Terrestrial CO2 sinks removed 29% of all anthropogenic emissions for the period 2000-2007, equivalent to an average of 2.6 PgC per year. Terrestrial ecosystems removed 2.9 PgC in 2007, down from 3.6 Pg in 2006, largely showing the high year-to-year variability of the sink. An analysis of the long term trend of the terrestrial sink shows a growing size of the CO2 sink over the last 50 years.
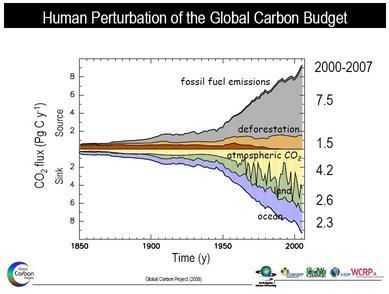
Based on the above findings about the evolution of carbon sources and sinks, the current global carbon dioxide flux emerges (figure 6, click to enlarge).
Conclusion
Anthropogenic CO2 emissions have been growing about four times faster since 2000 than during the previous decade, and despite efforts to curb emissions in a number of countries which are signatories of the Kyoto Protocol. Emissions from the combustion of fossil fuel and land use change reached the mark of 10 billion tones of carbon in 2007. Natural CO2 sinks are growing, but more slowly than atmospheric CO2, which has been growing at 2 ppm per year since 2000. This is 33% faster than during the previous 20 years. All of these changes characterize a carbon cycle that is generating stronger climate forcing and sooner than expected.
The Global Carbon Budget is the result of an international collaboration through the Global Carbon Project by Corinne Le Quéré (University of East Anglia/British Antarctic Survey, UK); Mike Raupach (CSIRO, Australia); Philippe Ciais (Commissariat a L'Energie Atomique, France); Thomas Conway (NOOA, USA); Chris Field (Carnegie Institution of Washington, USA); Skee Houghton (Woods Hole Research Center, USA); Gregg Marland (Carbon Dioxide Information Analysis Center, USA); Pep Canadell (CSIRO, Australia).
References:
Global Carbon Project: Carbon Budget 2007 [*.pdf] - September 26, 2008.
This new update of the carbon budget shows the acceleration of both CO2 emissions and atmospheric accumulation are unprecedented and most astonishing during a decade of intense international developments to address climate change. - Dr. Pep Canadell, executive director of the Global Carbon Project
 energy :: sustainability :: fossil fuels :: cement :: land-use :: deforestation :: carbon sink :: carbon flux :: carbon budget :: emissions :: climate change ::
 After decades of improvements, the carbon intensity of the global economy, the carbon emitted per unit of Gross Domestic Product (GDP), was stalled during the period 2003-2005. This change was largely caused by China’s rapidly growing share in economic output and carbon emissions. Since 2005 China’s energy intensity (which underpins carbon intensity) has decreased (improved) by 1.2% in 2006 and 3.7% in 2007 compared to 2005 levels (according to the National Energy Administration in China).
The global oceanic CO2 sink removed 25% of all CO2 emissions for the period 2000-2007, equivalent to an average of 2.3 PgC per year. The size of the CO2 sink in 2007 was similar to that in the previous year but lower by 0.1 PgC compared to its expected increase from atmospheric CO2 growth. This was due to the presence of a La Nina event in the equatorial Pacific. The Southern Ocean CO2 sink was higher in 2007 compared to 2006, consistent with the relatively weak winds and the low Southern Annular Mode (a circumpolar pressure oscillation between Antarctica and southern mid-latitudes). An analysis of the long term trend of the ocean sink shows a slower growth than expected of the CO2 sink over the last 20 years.
Natural Forest Sink
Terrestrial CO2 sinks removed 29% of all anthropogenic emissions for the period 2000-2007, equivalent to an average of 2.6 PgC per year. Terrestrial ecosystems removed 2.9 PgC in 2007, down from 3.6 Pg in 2006, largely showing the high year-to-year variability of the sink. An analysis of the long term trend of the terrestrial sink shows a growing size of the CO2 sink over the last 50 years.
Conclusion
Anthropogenic CO2 emissions have been growing about four times faster since 2000 than during the previous decade, and despite efforts to curb emissions in a number of countries which are signatories of the Kyoto Protocol. Emissions from the combustion of fossil fuel and land use change reached the mark of 10 billion tones of carbon in 2007. Natural CO2 sinks are growing, but more slowly than atmospheric CO2, which has been growing at 2 ppm per year since 2000. This is 33% faster than during the previous 20 years. All of these changes characterize a carbon cycle that is generating stronger climate forcing and sooner than expected.
The Global Carbon Budget is the result of an international collaboration through the Global Carbon Project by Corinne Le Quéré (University of East Anglia/British Antarctic Survey, UK); Mike Raupach (CSIRO, Australia); Philippe Ciais (Commissariat a L'Energie Atomique, France); Thomas Conway (NOOA, USA); Chris Field (Carnegie Institution of Washington, USA); Skee Houghton (Woods Hole Research Center, USA); Gregg Marland (Carbon Dioxide Information Analysis Center, USA); Pep Canadell (CSIRO, Australia).
References:
Global Carbon Project: Carbon Budget 2007 [*.pdf] - September 26, 2008.
posted by Biopact team at 12:54 PM
![]()
![]()


1 Comments:
And, we've got one of the "Coolest" years going since satellites started taking temperatures.
Come on guys, you're embarassing yourselves. The Pacific Decadal Oscillation has flipped to negative, and the sun is dormant. It'll probably be 25 years, or more, before we see another 1998.
In the meantime, the "Warmener" Crazies hate you, and all agriculture as much as they hate coal, and industry.
There are many compelling reasons to feel a sense of "urgency" about bioenergy in general, and biofuels in particular. You don't need the silly, soon-to-be-discredited CO2 bogeyman for a raison d'etra.
Post a Comment
Links to this post:
Create a Link
<< Home