Biofuels and renewables 'Country Attractiveness Indices' for Q1 2007
Ernst & Young recently released its Q1 2007 Renewable Energy Country Attractiveness Indices [*.pdf], a series of indices that rank countries on their commercial attractiveness with regards to alternative energy growth and development. These indices provide yardsticks for investors who want to know which markets offer the best near and long term alternative energy growth prospects.
The indices provide scores for national renewable energy markets, renewable energy infrastructures and their suitability for individual technologies. They take a generic view and different sponsor/financier requirements will clearly affect how countries are rated. Moreover, the indices were compiled from a purely commercial point of view, keeping in line with the current status quo of the globalised economy.
In the case of the Biofuels Country Attractiveness Indices, they say nothing about trade injustices or the politics of subsidies, which are so crucial for a debate about the potential drawbacks of biofuels. Neither do they keep in mind the efficiency of the biofuels in question or their effectiveness at mitigating climate change. The economy and its investors do not automatically mind the social and environmental sustainability of their ventures.
Referring to the recent investment boom in biofuels, the report says that:
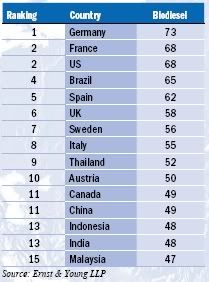
 Germany tops the Biodiesel Index with a long history of governmental and financial support for the industry but its score would have been higher were it not for last year’s reduction in excise tax incentives, in favour of blending targets, leading to concerns that the market is reaching overcapacity.
France is in second place with an established biodiesel industry currently supported by excise tax exemptions, but with EU blending targets to be met in the future. For example, Diester has announced an expansion programme for four plants ranging from 100,000 to 250,000 tonnes per annum (ktpa) by 2008.
The United States and Brazil both benefit from high diesel demand and the necessary arable land to grow feedstocks such as soy. EU markets that are large fossil fuel consumers such as Spain, where Grupo Natura have just inaugurated a 105ktpa plant and the UK with AIM listed producers D1 Oils and Biofuels Corporation, benefit most in the Index. Below them are the smaller economies – Sweden with its attractive offtake regimes; Italy with established biodiesel production and Austria whose industry grew up very much in line with Germany’s. Canada has some regulatory support and is located next to the large US market:
 bioenergy :: biofuels :: energy :: sustainability :: ethanol :: biodiesel :: investors :: infrastructure :: renewables :: wind :: solar ::
Biodiesel demand in China is expected to rise significantly in the future and ChinaAgri, who floated on the Hong Kong Stock Exchange this quarter, and CNOOC are both investing in capacity. However, regulatory support has been inconsistent and relatively little foreign investment has been attracted. Thailand, Malaysia and Indonesia have strong listed plantation investors such as Golden Hope and PTAsianAgri who produce biodiesel, and the regulatory regimes are now recognising this potential. Ethical concerns continue over agronomy practises in the region however. India has the potential to grow the high yielding feedstock jatropha and a large domestic fuel market but little biodiesel production at present.
Ethanol
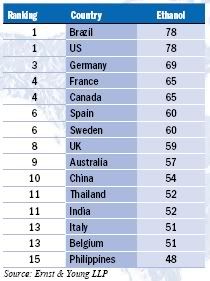
 Brazil and the US are joint top of the Ethanol Index (click to enlarge). Brazil enjoys a high yielding feedstock, sugar cane, high blending targets, various tax incentives, and a large production capacity. This is attracting foreign investment such as from AIM listed vehicles Infinity Bio-energy and Clean Energy Brazil. The US produced more ethanol that Brazil for the first time during 2006. Investment in the US is flowing from developers such as NYSE listed Aventine Renewables as well as through global corporations entering the business such as Virgin Fuels with their investment in Cilion and joint venture with NTR’s Bioverda. In addition, the Federal grants for second generation, or cellulosic, ethanol have encouraged the market. High corn prices are expected to soften following record levels of planting this season by US farmers.
Europe continues to be a relatively modest producer of ethanol with its largest producer, Germany, producing just a fraction of the United States’ production during 2006. Belgium's score suffers due to its low gasoline consumption and Italy's as a result of its low installed capacity. Q1 2007 alone has seen the financial close of the 400 milllion liters per year Ensus plant in the UK, Raffinerie Tirlemontoise’s 300 million liters/year plant in Belgium and Abengoa’s 200 million liters per year French facility.
Australia sits in the top ten thanks to some state level mandatory blending legislation and availability of the high yielding feedstock sugarcane. China too is piloting cellulosic technology due to a lack of grain. Investment today is at both ends of the value chain from state-owned grain trader COFCO and the nation’s largest oil producer CNPC. India produces significant levels of ethanol and will need to satisfy high future oil demands. Other South East Asian economies, such as Thailand and the Philippines, are implementing blending targets and should benefit from their proximity to China, India, South Korea and Japan for export purposes.
Biofuels Infrastructure Index
The Biofuels Infrastructure Index is an assessment by country of the general regulatory infrastructure for biofuels. On a weighted basis, the index considers:
This comprises two indices providing fuel specific assessments for each country, namely ethanol and biodiesel. Some markets may appear in one of these Fuel Specific Indices but not in the All Biofuels Index since certain markets have a particular bias toward one fuel type but not the other (hence the combined score is reduced). Each of the indices consider, on a weighted basis, the following:
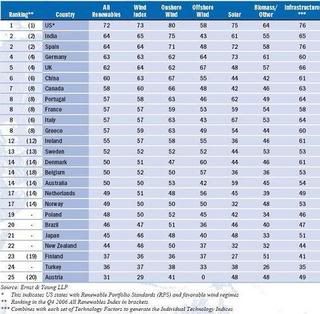
The All Renewables Index which includes onshore and offshore wind, solar and biomass looks as follows (click to enlarge):
More information:
Ernst & Young, Renewable Energy Group: Q1 2007 Biofuels Country Attractiveness Indices [*.pdf] - May 2007.
Ernst & Young, Renewable Energy Group: Q1 2007 Renewable Energy Country Attractiveness Indices [*.pdf] - May 2007.
The indices provide scores for national renewable energy markets, renewable energy infrastructures and their suitability for individual technologies. They take a generic view and different sponsor/financier requirements will clearly affect how countries are rated. Moreover, the indices were compiled from a purely commercial point of view, keeping in line with the current status quo of the globalised economy.
In the case of the Biofuels Country Attractiveness Indices, they say nothing about trade injustices or the politics of subsidies, which are so crucial for a debate about the potential drawbacks of biofuels. Neither do they keep in mind the efficiency of the biofuels in question or their effectiveness at mitigating climate change. The economy and its investors do not automatically mind the social and environmental sustainability of their ventures.
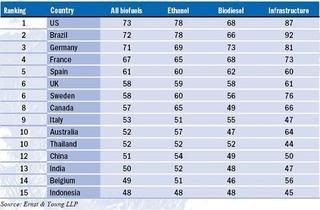
The Biofuels Country Attractiveness Indices rank the attractiveness of the top 15 global markets for investment in biologically derived renewable fuels incorporating both ethanol, and biodiesel. The Q1 2007 edition includes individual scores for bioethanol, biodiesel, and infrastructure, plus a combined score making up the All Biofuels Index.As such, the Index may be handy for investors, but for policy makers, environmentalists or energy analysts they are of less use. The top 15 stack up as follows on the All Biofuels Index (click to enlarge):
Referring to the recent investment boom in biofuels, the report says that:
Growing optimism in the sector has not been lost on investors who are showing an appetite to take advantage of the growth potential and capital requirement of the market with over US$400m invested in 2006 and analysts predicting a compound annual growth rate for the industry of 30% in the medium term.Biodiesel
 Germany tops the Biodiesel Index with a long history of governmental and financial support for the industry but its score would have been higher were it not for last year’s reduction in excise tax incentives, in favour of blending targets, leading to concerns that the market is reaching overcapacity.
France is in second place with an established biodiesel industry currently supported by excise tax exemptions, but with EU blending targets to be met in the future. For example, Diester has announced an expansion programme for four plants ranging from 100,000 to 250,000 tonnes per annum (ktpa) by 2008.
The United States and Brazil both benefit from high diesel demand and the necessary arable land to grow feedstocks such as soy. EU markets that are large fossil fuel consumers such as Spain, where Grupo Natura have just inaugurated a 105ktpa plant and the UK with AIM listed producers D1 Oils and Biofuels Corporation, benefit most in the Index. Below them are the smaller economies – Sweden with its attractive offtake regimes; Italy with established biodiesel production and Austria whose industry grew up very much in line with Germany’s. Canada has some regulatory support and is located next to the large US market:
 bioenergy :: biofuels :: energy :: sustainability :: ethanol :: biodiesel :: investors :: infrastructure :: renewables :: wind :: solar ::
 Biodiesel demand in China is expected to rise significantly in the future and ChinaAgri, who floated on the Hong Kong Stock Exchange this quarter, and CNOOC are both investing in capacity. However, regulatory support has been inconsistent and relatively little foreign investment has been attracted. Thailand, Malaysia and Indonesia have strong listed plantation investors such as Golden Hope and PTAsianAgri who produce biodiesel, and the regulatory regimes are now recognising this potential. Ethical concerns continue over agronomy practises in the region however. India has the potential to grow the high yielding feedstock jatropha and a large domestic fuel market but little biodiesel production at present.
Ethanol
 Brazil and the US are joint top of the Ethanol Index (click to enlarge). Brazil enjoys a high yielding feedstock, sugar cane, high blending targets, various tax incentives, and a large production capacity. This is attracting foreign investment such as from AIM listed vehicles Infinity Bio-energy and Clean Energy Brazil. The US produced more ethanol that Brazil for the first time during 2006. Investment in the US is flowing from developers such as NYSE listed Aventine Renewables as well as through global corporations entering the business such as Virgin Fuels with their investment in Cilion and joint venture with NTR’s Bioverda. In addition, the Federal grants for second generation, or cellulosic, ethanol have encouraged the market. High corn prices are expected to soften following record levels of planting this season by US farmers.
Europe continues to be a relatively modest producer of ethanol with its largest producer, Germany, producing just a fraction of the United States’ production during 2006. Belgium's score suffers due to its low gasoline consumption and Italy's as a result of its low installed capacity. Q1 2007 alone has seen the financial close of the 400 milllion liters per year Ensus plant in the UK, Raffinerie Tirlemontoise’s 300 million liters/year plant in Belgium and Abengoa’s 200 million liters per year French facility.
Australia sits in the top ten thanks to some state level mandatory blending legislation and availability of the high yielding feedstock sugarcane. China too is piloting cellulosic technology due to a lack of grain. Investment today is at both ends of the value chain from state-owned grain trader COFCO and the nation’s largest oil producer CNPC. India produces significant levels of ethanol and will need to satisfy high future oil demands. Other South East Asian economies, such as Thailand and the Philippines, are implementing blending targets and should benefit from their proximity to China, India, South Korea and Japan for export purposes.
Biofuels Infrastructure Index
The Biofuels Infrastructure Index is an assessment by country of the general regulatory infrastructure for biofuels. On a weighted basis, the index considers:
- Market regulatory risk – 29%: The score in this category depends on how strongly the general regulatory, political and economic environment in the respective market encourages the production, distribution and use of biofuels
- Supporting infrastructure – 42%: A market with sufficient arable land available to cultivate, an established and widespread distribution network and R&D activity will score well
- Access to finance – 29%: Markets with a sound financial industry, proven financial track record of financing biofuels projects, listed companies operating in the biofuels sector and strong appetite by foreign and domestic investors score highly
This comprises two indices providing fuel specific assessments for each country, namely ethanol and biodiesel. Some markets may appear in one of these Fuel Specific Indices but not in the All Biofuels Index since certain markets have a particular bias toward one fuel type but not the other (hence the combined score is reduced). Each of the indices consider, on a weighted basis, the following:
- Offtake incentives – 25%: This includes the level of mandatory blending targets, tax breaks on fuel excise duty and tax credits awarded to biofuels producers
- Tax climate – 8%: Countries that create a favourable tax climate such as enhanced capital allowances or corporation tax holidays will score highly
- Grants and soft loans – 8%: Comprises grants and soft loans for investment in biofuels production
- Current installed base – 11%: Existing production capacity installed in a country
- Domestic market growth potential – 15%: Gasoline/petrol or diesel consumption of a country is used to determine the ultimate growth potential for alternative fuels
- Export potential – 15%: A market’s score is determined by its geographical location and any free trade agreements it is a party to
- Feedstock – 10%: Takes into account the energy yield, sustainability and price volatility of a country’s main biofuels feedstocks
- Project size – 8%: Large projects provide economies of scale which facilitates project development
The All Renewables Index which includes onshore and offshore wind, solar and biomass looks as follows (click to enlarge):
More information:
Ernst & Young, Renewable Energy Group: Q1 2007 Biofuels Country Attractiveness Indices [*.pdf] - May 2007.
Ernst & Young, Renewable Energy Group: Q1 2007 Renewable Energy Country Attractiveness Indices [*.pdf] - May 2007.
 --------------
 Spanish energy and engineering group Abengoa will spend more than €1 billion (US$1.35 billion) over the next three years to boost its bioethanol production, Chairman Javier Salgado said on Tuesday. The firm is studying building four new plants in Europe and another four in the United States.


0 Comments:
Post a Comment
Links to this post:
Create a Link
<< Home